#4 Run From Aging: Part 3
Learn about the performance physiology of elite ultramarathon runners.
In the last two weeks, we covered the physiology of the former and current age 70+ marathon record holders. This week, we go further. Ultramarathon distance.
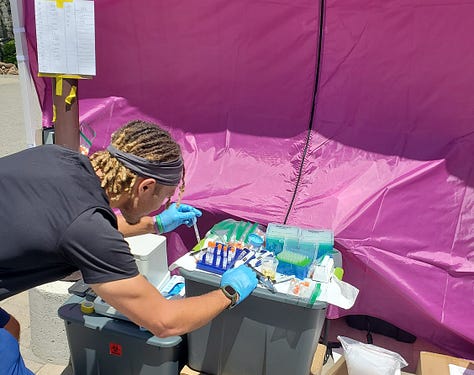
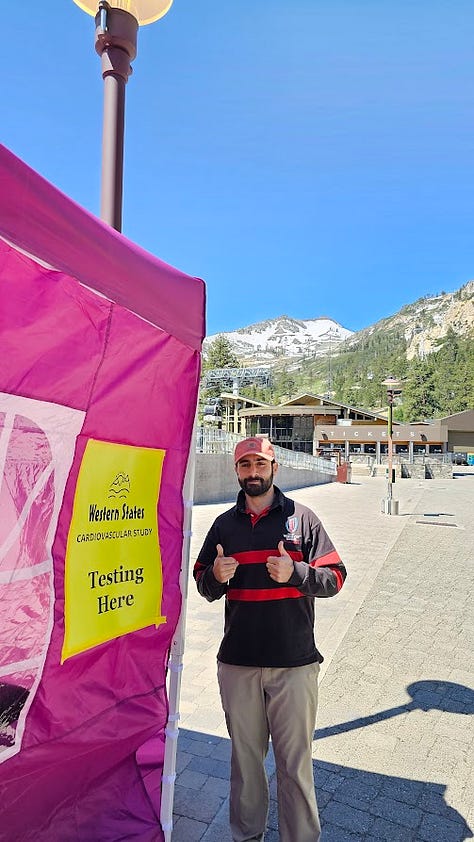
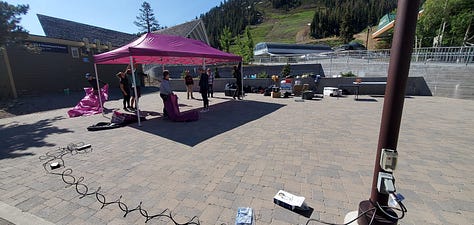
Last weekend, our team tested athletes at the Western States running race.
It was great to work with the “cardio crew” pictured above through some long days and nights. Also, yes, we held this pose until the countdown timer hit 12:00:00 exactly.
Field Study
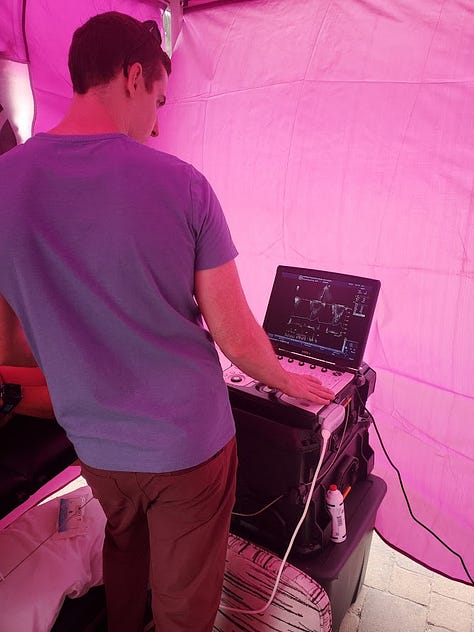
Blood pressure, blood vessel function, artery stiffness, kidney function, heart function, blood samples, and urine samples. We’ll be working on analyzing all of our exciting data in the coming months!
Until those results are ready, check out some action photos below.
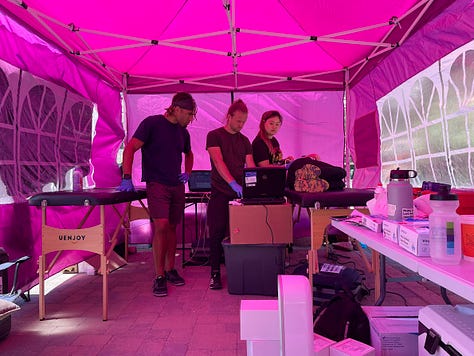
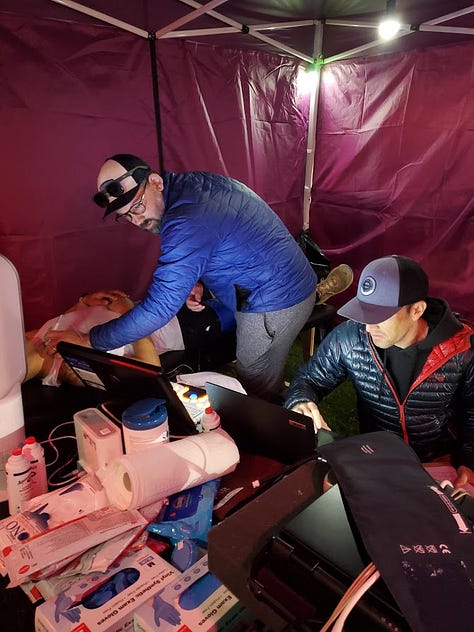
Back to the race
Despite a grueling 100.2-mile course through the mountains (>17,500 ft of elevation), 87% of the 379 runners finished. Sticking to our aging theme, let’s split up those who finished and those who did not finish (DNF).
Those who finished were, on average, younger. Not too surprising.
Would you finish?
Below, I calculated the probability of finishing for each decade. Keep in mind, this is from a very biased sample. Every racer completed at least a 61-mile race to qualify. Thus, I use “you” very loosely in the section title :).
There seemed to be a step decline after increasing age from the 40’s.
Age vs. finish times
I was curious about how much age might affect finish times. I guessed it would be strongly associated with finish times. Let’s look at the data.
Since I had more data points to play with, I split up the males and females. You can appreciate the increase in finish time (capped at 30 hours) with the increase in age (as expected). I used a non-linear approach since it gave a stronger fit to the data points than just a straight line.
The goodness of fit (R^2; a fancy term for how well our lines represent the samples) would be considered weak because it is <0.50. Another way to think about it is that age explains ~30% of the variance in finish times. A notable factor, but not monumentally important.
*The two lines of best fit were not statistically different between males and females. In short, we probably would be fine treating this as one group with one line of best fit.
What do published reports say?
With more data available for shorter distances, I pulled some data from marathon runners. These data come from unicorns. Folks who ran a sub-3-hour marathon in five different decades (1970s to 2010s).
Here, it’s easy to see that about age 50 is when the longest marathon times occur. Since the graph I had above had time and not pace, I made a new graph below to compare to this dataset.
The small number of Western States runners under age 30 makes the comparison tricky. But, the clear takeaway again is an age-related loss in running velocity.
How fast does aging slow runners?
A neat analysis from the authors of the earlier dataset was figuring out the rate of slowing down per year. The figure below shows a 1-minute increase in marathon time per year.
For comparison, the Western States runners showed a 4-minute increase in marathon pace per year.
*I used a linear model for this comparison to make things easy.
Why the differences?
The much longer 100-mile race might augment age-related differences in pace.
The study was WITHIN certain people, whereas the Western States race was BETWEEN different people.
Importantly, expressing this as a percent tells the same story -0.8%/year for Western States compared with -0.7%/year in the graph.
Takeaways
Age likely only slows us down ~1% per year.
Training likely slows this rate of decline down.
Despite these effects of aging, a large proportion of runners over age 50 completed a grueling 100-mile race in the mountains.
In future posts, we’ll get deeper into the physiology of performance.
What’s to come? Info about:
- how muscles work
- nutritional strategies
- training
- sleep
- genetics
and more
Thanks for reading! As always, feel free to share your thoughts, comments, and questions.
Stay curious,
Joe
Want to learn more? Check out these related resources.
Who else is part of the “cardio crew”: Matthew Babcock, Jimmy Bagley, Omar El-Kurd, Greg Grosicki (our fearless leader), Soolim Jeong, Braxton Linder, Austin Robinson, Nina Stute, & Joe Vondrasek.
Want to find a race near you? Check out this list of races.


